

Impact Benchmarks
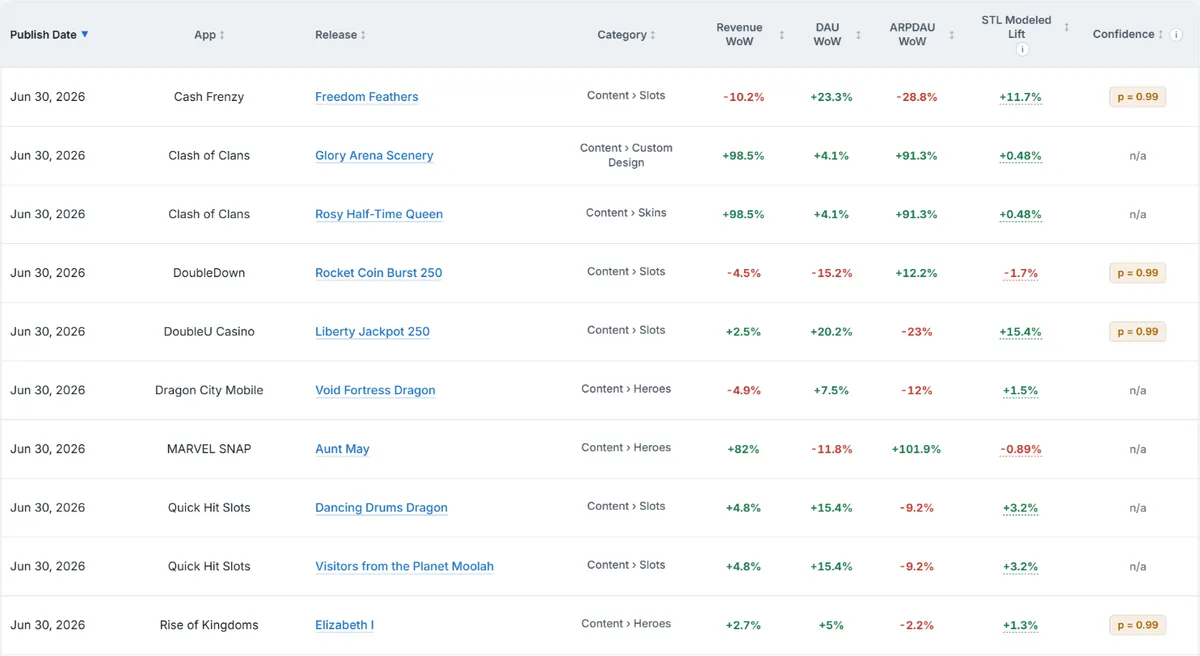
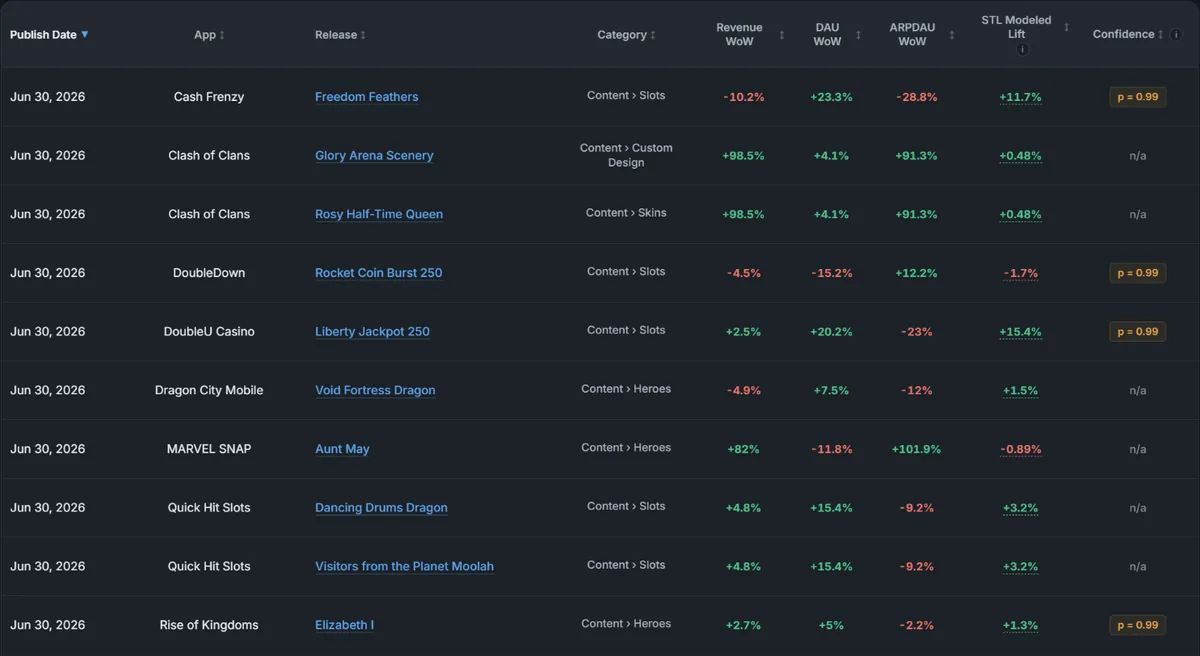
Impact Benchmarks is a table of individual releases with the change measured around each one.
Columns
Section titled “Columns”| Column | What it holds |
|---|---|
| Publish Date | When the release was published. |
| App | The app it ran in. |
| Release | The release title. |
| Category | Its release type and mechanic family. |
| Revenue, DAU, and ARPDAU WoW | Week-over-week change across those three measures. |
| STL Modeled Lift | Modelled lift against an expected baseline. |
| Confidence | How strong the result is. |
Reading the Numbers
Section titled “Reading the Numbers”STL Modeled Lift is a DAU measure, not a revenue one. It compares actual DAU against the DAU the model expected, over the first three days.
The Confidence value is a p-value from the revenue model. The two columns come from different models, so read them as two separate pieces of evidence.
Sorting
Section titled “Sorting”Every column sorts across the whole matched set, not just the rows on screen. Rows with no value sort last.
Filtering
Section titled “Filtering”The sidebar carries the same mechanic, market, genre, subgenre, app, and tag filters as the Feature Database.